
Chart of the Day 9/3/25: Should You Worry About THIS September?
Should you worry about September? History suggests the month can be a rough one for stocks. BUT a closer look at the data suggests there’s more to the scary seasonality story than meets the eye.
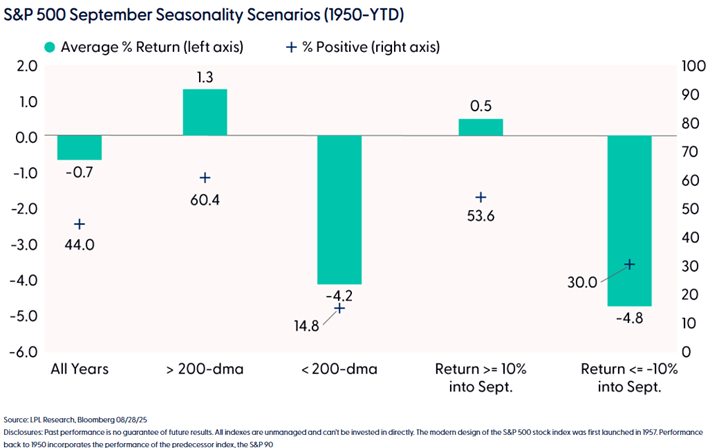
First, let’s stipulate that September has historically been the worst month for investors. Over the last 75 years, the S&P 500 Index (SPY) has lost 0.7% on average this month. Only 44% of Septembers during that timeframe sported positive returns. In negative years, the average loss was 3.8%. Ugh.
But take a look at the MoneyShow Chart of the Day, which comes from LPL Financial. You’ll see that – in their words – “context is key when it comes to seasonal data.”
Source: LPL Financial
(If you want to get more articles and chart analysis from MoneyShow, subscribe to our Top Pros’ Top Picks newsletter here)
When the S&P was trading above its 200-day moving average heading into the month – like it was in 2025 – results have been better. September was positive in just over 60% of those years, with average returns of 1.3%. Other data suggests that strong market years overall have featured less “pain” in September.
We certainly didn’t get off on the right foot Tuesday, with equities stumbling, bond yields jumping, and gold soaring. The asset performance mix suggests investors are worried about inflation, volatility, and headaches on both the fiscal and monetary policy front.
But before you get TOO freaked out by the change in the calendar, consider that we came into the month with a solid head of steam. And all else being equal, that helps bolster our chances for a better September showing!